Cluster 03 · Home Service Operations Ecosystem
Defining the SolutionTransforming Opportunities into Solutions


What deserves to be built?
The research showed me what was wrong. Mapping the ecosystem showed me how everything was connected. Now I had to decide what to do about it. Instead of adding features, I focused on the opportunities that could make the greatest impact across the entire service.
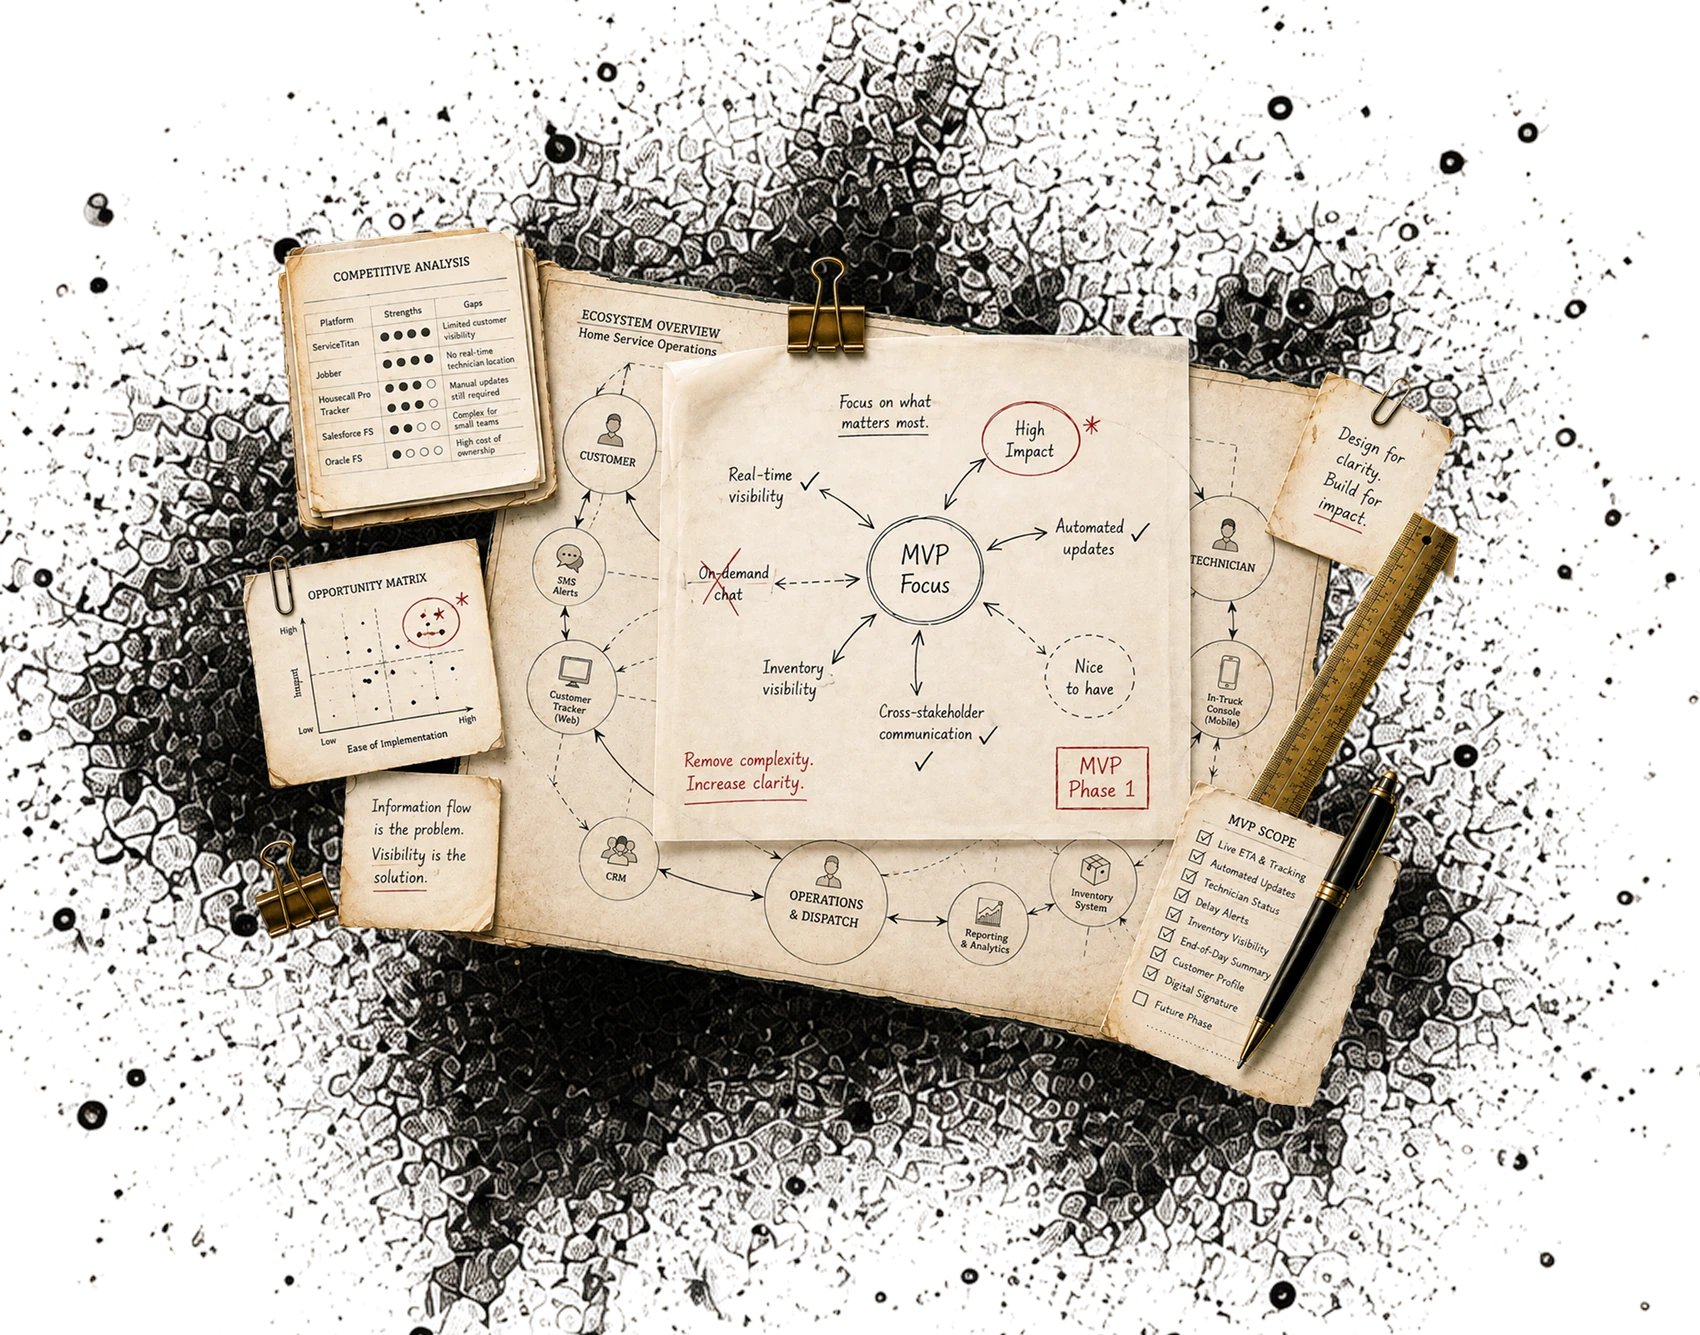
Five artifacts, in the order they were built.
Scroll to explore
01
Competitive Analysis
Comparing what exists
Evaluated existing home service platforms to understand current capabilities, identify market patterns and uncover unmet needs.
Most platforms optimize scheduling and dispatch, but few connect customers, technicians and operations through Shared, Real-Time Information.

| Capability | Service Titan | Housecall Pro | Jobber | Proposed Solution |
|---|---|---|---|---|
| Live ETA | Partial | Partial | Partial | Supported |
| Technician location | Supported | Partial | Partial | Supported |
| Automatic customer updates | Partial | Partial | Partial | Supported |
| Automatic delay notifications | Partial | Partial | Partial | Supported |
| Inventory visibility for dispatch | Partial | Not available | Not available | Supported |
| Customer service dashboard | Not available | Not available | Not available | Supported |
| Dispatch dashboard | Supported | Partial | Supported | Supported |
| Shared visibility across all stakeholders | Not available | Not available | Not available | Supported |
| Cross-stakeholder communication | Not available | Not available | Not available | Supported |
| Designed for small and medium businesses | Enterprise focus | Supported | Supported | Supported |

02
Opportunity Matrix
Ranking what matters most
Prioritized opportunities by balancing user value, business impact and implementation effort.
The highest-value improvements weren't new features. They were the ones that Eliminated Uncertainty across multiple stakeholders.
This is where the opportunity became clear.
Two land in the sweet spot.
03
Design Opportunities
Turning findings into openings
Translated research findings into actionable design opportunities that addressed the root causes identified during research.
Every opportunity focused on Improving Information Flow rather than adding complexity.


| Research finding | Existing solutions | The solution |
|---|---|---|
| Customers waited hours with no updates | Basic notifications | Live appointment tracking with dynamic ETA |
| Customers called support for updates | Limited proactive communication | Automatic delay notifications |
| Customers experienced long periods of uncertainty | Fixed appointment windows | Continuous appointment visibility |
| Technicians still rely on paper documentation | Mobile reporting still requires manual documentation | Mobile reporting submitted immediately after job completion |
| Technicians lacked inventory visibility | Inventory exists but is not always surfaced at the right moment | Inventory integrated directly into the work order |
| Dispatch could not see the whole picture | Operational dashboards focus on dispatch only | Shared visibility across customers, field technicians and Operations & Dispatch |
| Communication relied on disconnected tools | Separate communication tools | Unified communication throughout the appointment lifecycle |

04
MVP Scope
Cutting to the essential
Defined the minimum set of features needed to solve the core problem while delivering value to all three stakeholder groups.
A focused MVP creates more impact than a feature-rich product that Doesn't Solve the Right Problem.
Customer
- Appointment tracking
- Real-time ETA
- Delay notifications
- Technician info
- Appointment updates
Technician
- Job details
- Customer notes
- In-truck reporting
- Materials tracking
- Status updates
Operations
- Live dashboard
- Technician visibility
- Schedule management
- Customer communication
- Inventory visibility
- Operational reporting

05
Full Home Service Operations Report
Bringing it all together
Consolidated the research, systems analysis, design decisions and solution strategy into a single implementation document.
The final solution wasn't a collection of features. It was a Connected Service Ecosystem built from evidence.
Home Service Operations Ecosystem
- Executive summary
- It started with one question
- The challenge and hypothesis
- Research across three stakeholder groups
- What the research revealed
- Underlying issue and root causes
- Personas
- Journey maps
- Service design artifacts
- Stakeholder map
- Service blueprint
- Ecosystem diagram
- Workflow architecture
- Information architecture
- Shared data layer
- Competitive analysis
- Design opportunities
- Opportunity matrix
- Minimum viable product
- Wireframes and prototypes
- High-fidelity prototypes
- Conclusion and reflection