Workflow 1: Customer Service Journey Workflow
// workflow 1 & 2 connects from Appointment Confirmed (inventory trigger)// workflow 1 & 2 connects from Special Part Identified// workflow 1 & 3 connects from Appointment DayStart (rectangle terminal)Schedule AppointmentCustomer Problem DescriptionCustomer Uploads PhotosDispatcher ReviewDoes the Technician Need to Review it?YESTechnician ReviewSpecial Part Identified (by Technician)NoSpecial Part Identified (by Dispatcher)Special Part Identified// connects to workflow 2Alert to DispatchSpecial Order Part Required?YesOrder PartWait For ArrivalSchedule AppointmentNoStandard SchedulingAppointment Confirmed// connects to workflow 2, triggers "Trigger: System Detects All Confirmed Appointments for Tomorrow"Appointment ScheduledCustomer Requests Change on appointment?YesReschedule or Cancel? (decision)Reschedule Appointment → Update Schedule → Appointment Confirmed → Appointment Scheduled → Appointment DayCancel Appointment → Update Schedule → Notify Dispatch → End (rectangle terminal)// connects to workflow 5NoAppointment DayNotify Dispatch// connects to Workflow 5Update scheduleAppointment Day// triggers Workflow 3Receive Reminder NotificationReceive Technician Information (Photo + Name)Track Technician (Live Tracking + ETA)Appointment Chat (if needed)Technician Arrives// occurs simultaneously with workflow 3 "Arrive On Site"Service Performed// occurs simultaneously with workflow 3 "Perform Service"Digital Signature// occurs simultaneously with workflow 3 "Customer Digital Signature"Auto Generated Service SummaryPast Visits UpdatedEnd (rectangle terminal)Support (if needed):// connects to workflow 5Contact Support (Feedback)// connects to workflow 5Report Issue// connects to workflow 5Follow Up Request// connects to workflow 5End (rectangle terminal)// Support branch does not loop back into main path
Workflow 2: Inventory Readiness Workflow
// workflow 2 to 3 connects at Ready for Service// workflow 2 to 5 connects missing materials// connects from workflow 1 (Appointment Confirmed and Special Part Identified)Start (rectangle terminal)Trigger: System Detects All Confirmed Appointments for Tomorrow// connects from workflow 1Automated Inventory ScanAll Materials Available at Warehouse?YesReady for TomorrowSystem Notification to Technician (Inventory Confirmed)NoMissing Materials Alert to DispatchDispatch Receives Alert of Missing Materials or Special Part Request// connects to workflow 5Inventory Check:Truck InventoryWarehouse InventoryParts AvailabilityIs Inventory Low?YesForward To Inventory DepartmentInventory Request SubmittedParts Received// connects to same workflow, Inventory ReadyNoInventory Confirmed// connects to same workflow, Inventory ReadyInventory Ready:// connects from Parts Received and Inventory ConfirmedParts ApprovedParts Ready for Technician at WarehouseSystem Notification to Technician (Parts Ready)End (rectangle terminal)// connects to workflow 3, Ready for Service
Workflow 3: Technician Service Workflow
// workflow 2 & 3 connects at Ready for Service// workflow 3 & 4 connects during Navigate to Customer & Job in Progress// workflow 3 & 6 connects at Job Completion// workflow 3 to 5 connects from Appointment Missed// workflow 3 to 5 connects from Create Customer No Show Alert// workflow 4 to 3 connects from Notify New Technician With New Job (reassignment)Start (rectangle terminal)Start New Day// connects from workflow 2Check Inventory TodayConfirm InventoryStart DayStart New Job// also re-entry point for reassigned technicians from workflow 4View Next Job PreviewReview Job DetailCustomer NotesProblem DescriptionPhotosMaterials NeededService HistoryNavigate to Customer// connects to workflow 4 (Traffic Delay)Customer Receives Live TrackingTechnician Arrive On Site// occurs simultaneously with workflow 1 "Technician Arrives"Is the Customer Home?YesCustomer is HomeUpdate Status: On SiteUpdate Status: Job in Progress// connects to workflow 4 (Job Delay)Perform Service// occurs simultaneously with workflow 1 "Service Performed"Capture Photos + SignatureRecord Materials UsedComplete ReportUpdate Status: FinishedAuto Generated Summary// connects to workflow 6, Jobs CompletedStart Next JobNoCustomer is Not HomeNotify DispatchCreate Customer No Show Alert// connects to workflow 5Attempt Customer ContactCustomer Reached?YesWait for CustomerResume Appointmentloop back to Update Status: Job in ProgressNoAppointment Missed// connects to workflow 5Notifies DispatchDispatch Reviews Schedule ImpactMove Up Remaining CustomersUpdate ETAsUpdate ScheduleJob Rescheduled→ Start Next Job// rejoins main loopIs This the Last Job?No → loop back to Start New JobYes → End of Day// rectangle terminal// triggers workflow 6
Workflow 4: Technician Delay Management Workflow
// workflow 4 & 3 connects from Navigate to Customer & Job in Progress// workflow 4 to 5 connects from Dispatch Receives Delay Trigger// Delay Data contributes to workflow 6// workflow 4 to 3 connects from Notify New Technician With New JobStart (rectangle terminal)Delay DetectedDispatch Receives Delay Trigger// connects to Workflow 5Dispatch Contacts TechnicianTechnician Confirms Delay EstimateDecision: How Long is the Delay?IF delay is 1 hour or lessSystem sends updated ETA to customerCustomer tracks new arrival timeDispatch Reviews Schedule ImpactResolved (oval terminal)IF delay is more than 1 hour and less than 3 hoursSystem sends updated ETA to customerCustomer tracks new arrival timeDispatch monitors downstream scheduleDispatch Reviews Schedule ImpactResolved (oval terminal)IF delay is more than 3 hoursDispatch checks nearby technician availabilityDecision: Is another technician available?YesReassign job to nearby technicianNotify original technicianNotify new technician with new job// connects to workflow 3, Start Next JobSend updated technician info to customerSend updated ETA to customerCustomer tracks new arrival timeResolved (oval terminal)NoNotify customer of 3+ hour delayOffer option to keep appointment or rescheduleUpdate scheduleAppointment confirmedDispatch Reviews Schedule ImpactDispatch monitors resolution follow upResolved (oval terminal)
Workflow 5: Dispatch Operations Workflow
// Workflow 5 contributes to workflow 6// workflow 3 to 5 connects from Appointment Missed// workflow 3 to 5 connects from Create Customer No Show Alert// workflow 4 to 5 connects from Delay// workflow 2 to 5 connects from Missing Materials AlertStart day (rectangle terminal)Review daily scheduleMonitor:Live MapActive JobsAlertsIssue detected?YesIdentify Issue:Delay// hand off from workflow 4Missing Materials// hand off from workflow 2Appointment MissedCustomer RequestEmergency JobCustomer No-Show AlertTechnician IssueDetermine Resolution:Notify TechnicianNotify CustomerUpdate ScheduleCoordinate ResolutionEvaluate CoverageReassign TechnicianEvaluate Schedule ImpactReassign If NeededTrack ResolutionIssue Resolved?YesClose IssueUpdate ScheduleReturn to Monitoring// loops back to Monitor:NoContinue Monitor// loops back to Monitor::End Day// rectangle terminal, triggers workflow 6
System Workflow 6: Automated Reporting Workflow
// triggered by Workflow 5 "End Day"// compiles data from Workflow 1 (satisfaction), Workflow 2 (materials used), Workflow 3 (jobs), Workflow 4 (response times)Starts (rectangle terminal)End of DaySystem Compiles Daily Data:Jobs CompletedJobs IncompleteMaterials UsedResponse TimesCustomer Satisfaction ScoresReports Generated Automatically:Daily Operations ReportTechnician Performance ReportInventory Usage ReportException ReportReports Pushed To:Dispatch DashboardOperations ManagerBusiness LeadershipEnd Of Process (rectangle terminal)
Flow of the Ecosystem
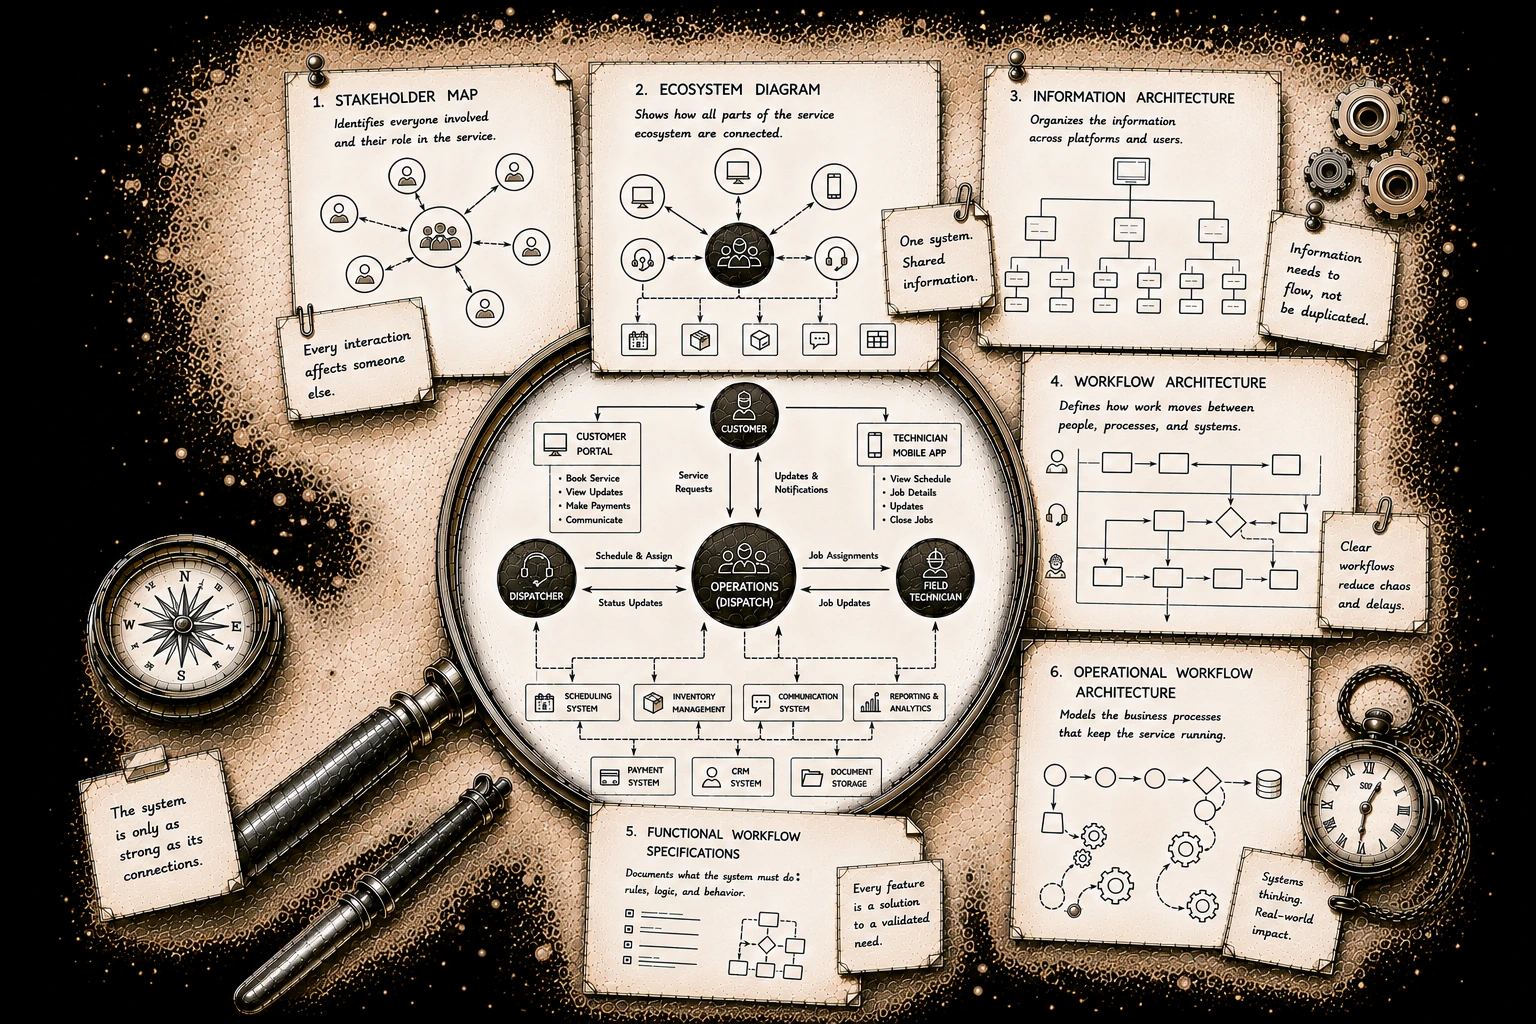
Workflow 1 creates appointments.Workflow 2 prepares inventory.Workflow 3 executes service.Workflow 4 manages delays.Workflow 5 coordinates operational issues.Workflow 6 analyzes the results and generates reports.